📊 Analyzing Stock Trends
Master stock trend analysis techniques and use real-world strategies to optimize your trading decisions.
📈 Core Concepts
- Trend Lines: Visual guides for support/resistance
- Moving Averages: Filter out noise (SMA, EMA)
- Indicators: RSI, MACD, Bollinger Bands
- Patterns: Head & Shoulders, Flags, Double Tops
🔍 Example: Trendline Breakout
Combining indicators like RSI divergence with a trendline break can provide confirmation and increase the confidence of a trade.
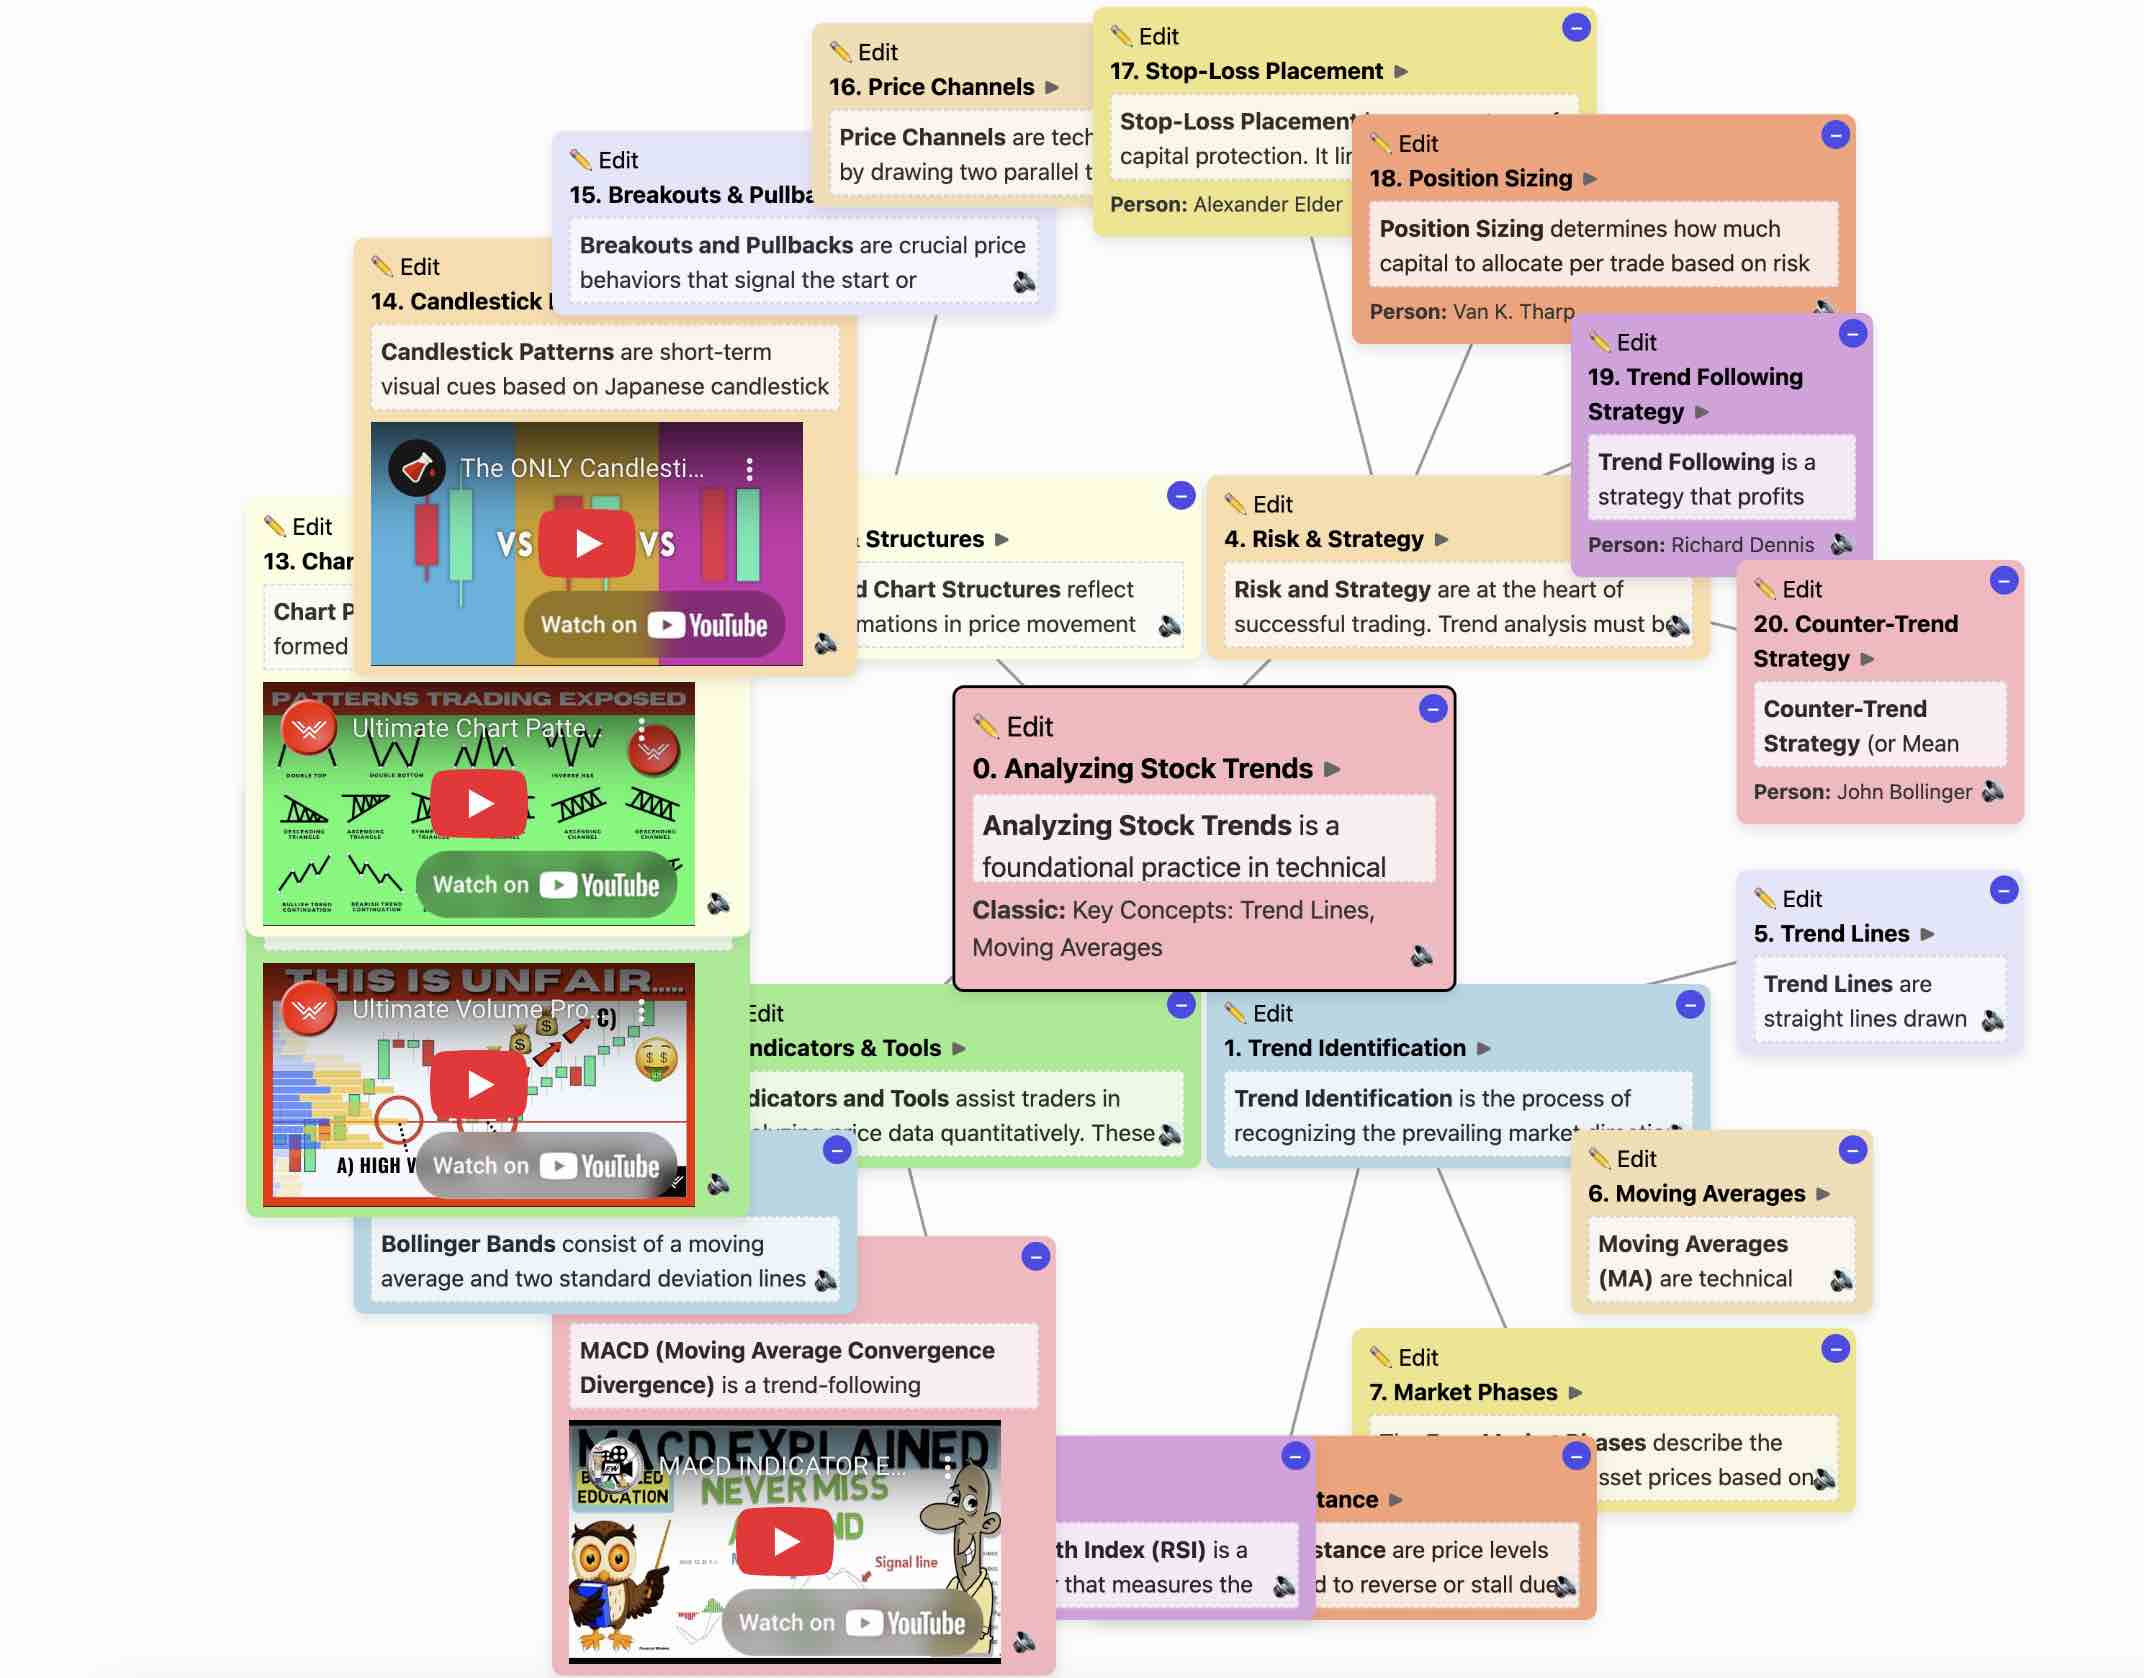
🎯 Trend Identification
By identifying market phases like accumulation, markup, distribution, and markdown, traders can adjust their strategies accordingly.
🛠️ Indicators in Action
- RSI: Spot overbought/oversold zones
- MACD: Detect momentum shifts
- Bollinger Bands: Understand volatility
📊 Patterns & Breakouts
Patterns like head-and-shoulders or triangles help predict future price movements. Breakouts backed by volume tend to be more reliable.
🔐 Risk Management
No matter how strong the technical signals are, risk management is crucial. Use stop-losses and carefully manage position sizes.
📘 Learn more: Trend Trading Strategies