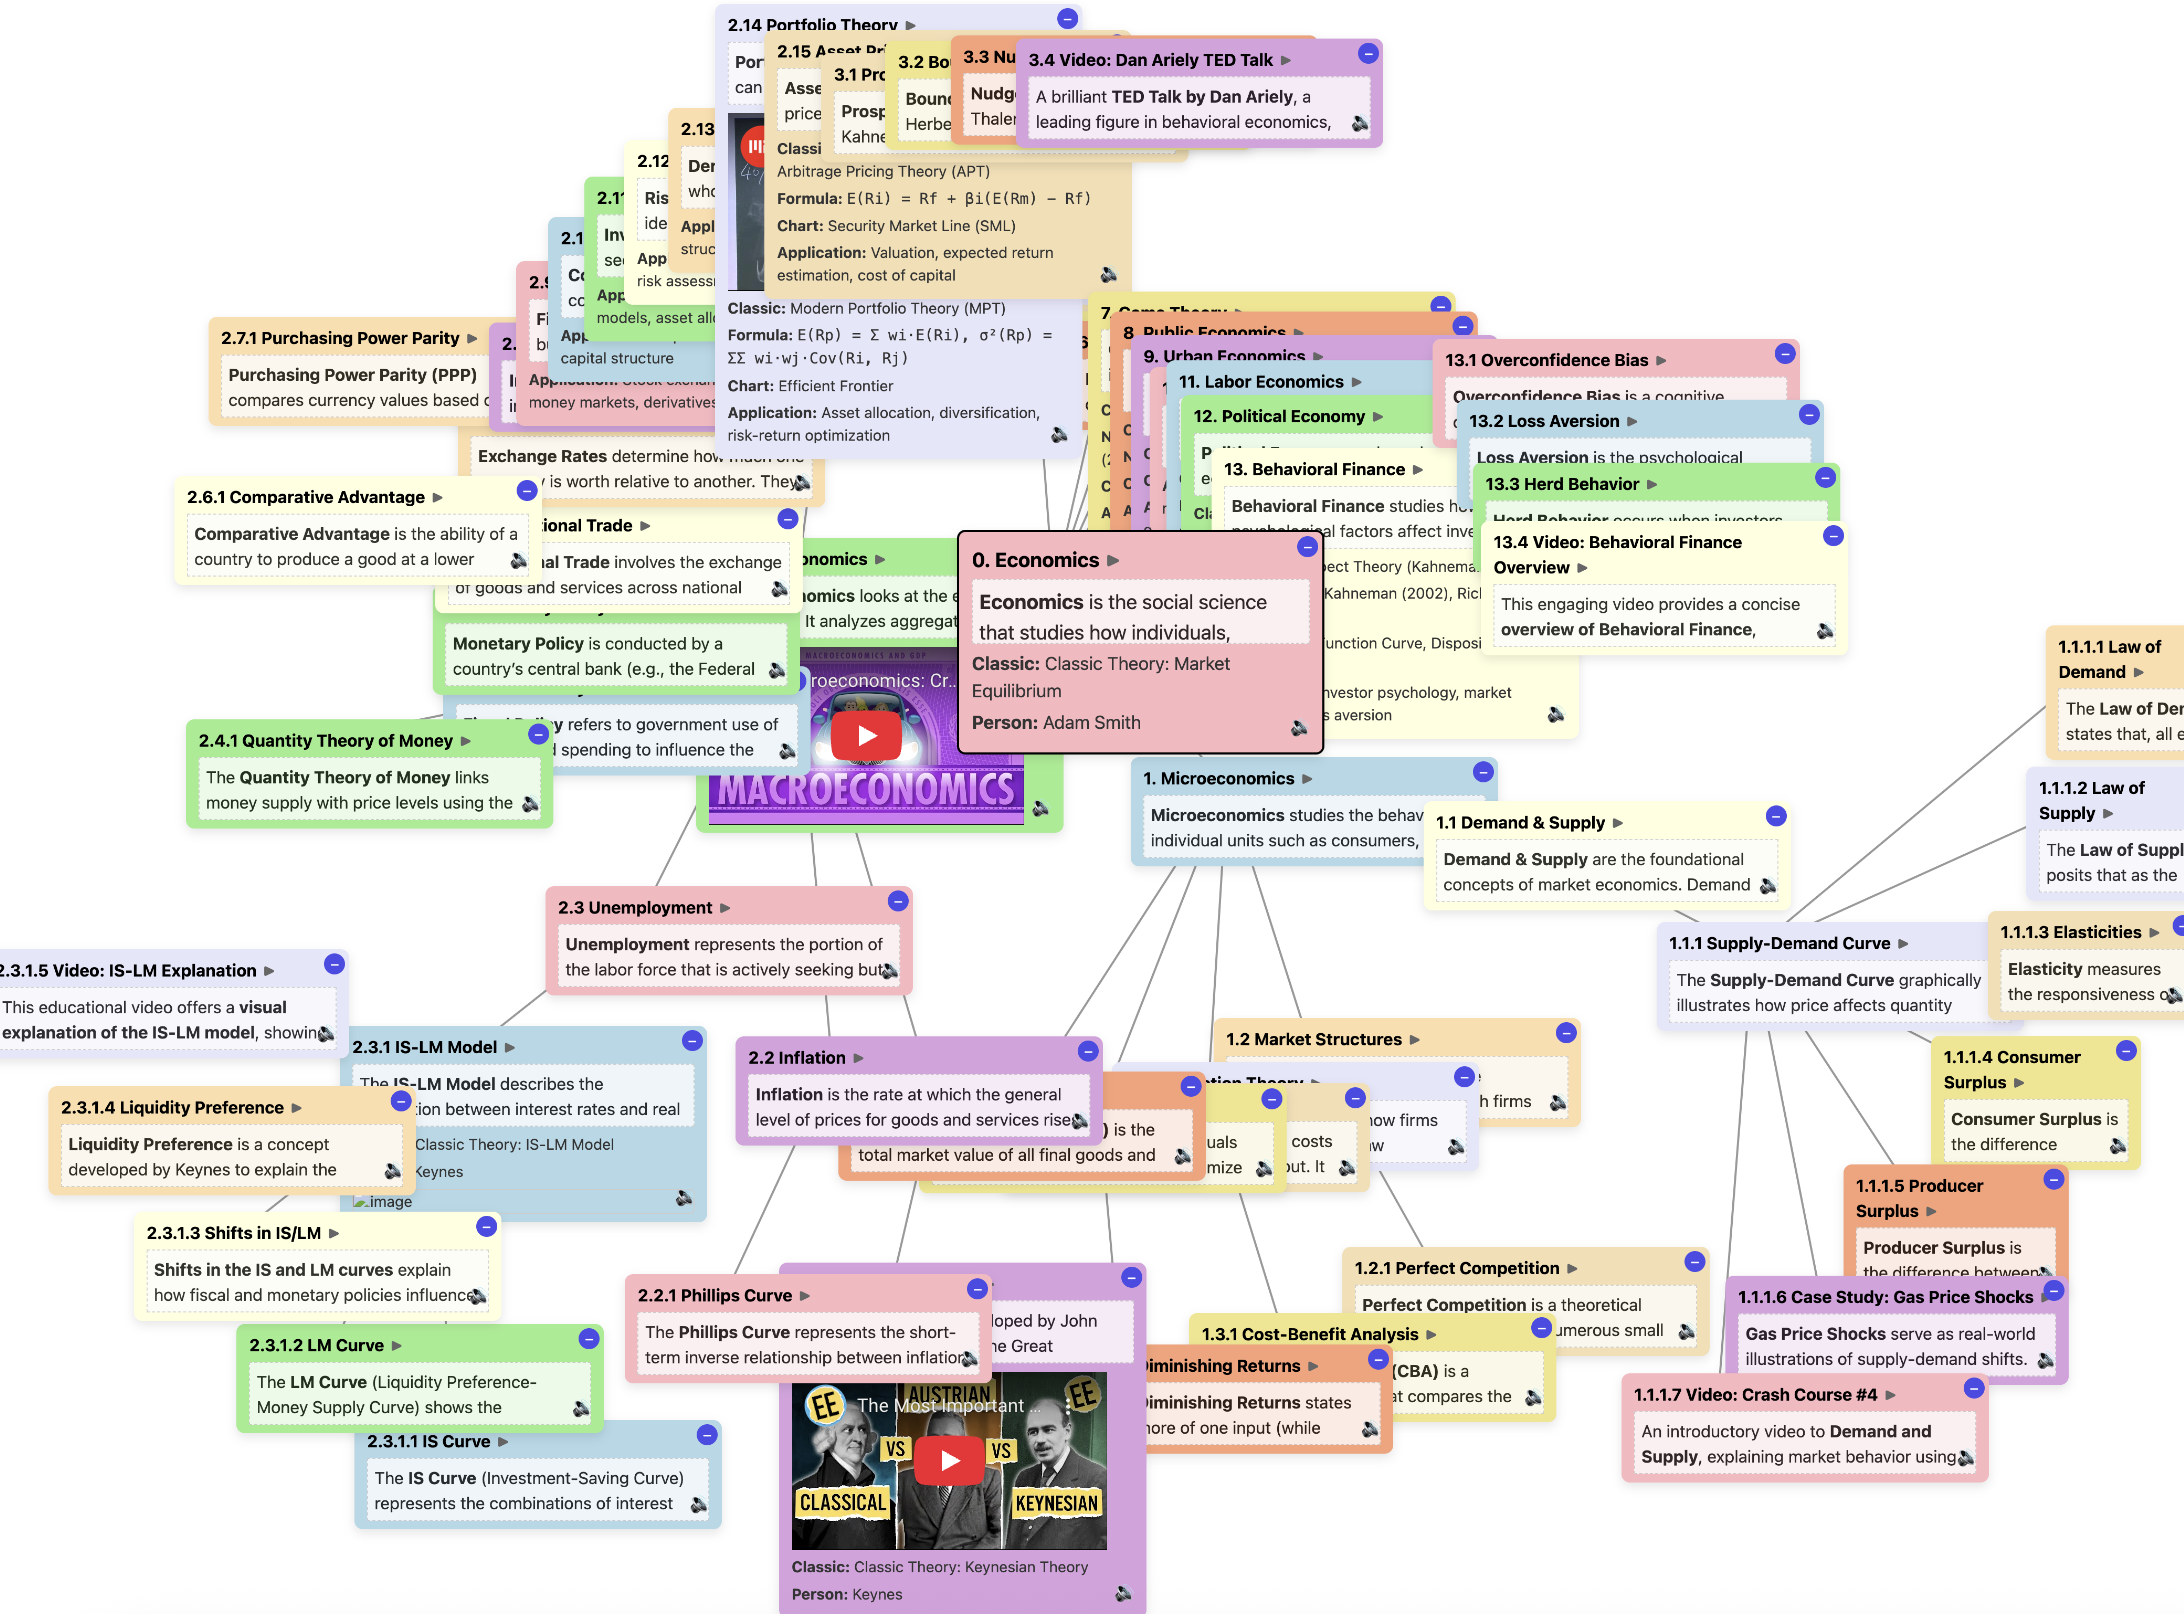
Economics Interactive Mind‑Map
Dive into 200+ interconnected economic concepts spanning macro, micro, policy, models, data & case studies – all in one visual, explorable graph.
Unlock All →📘 Visualize Comprehensive Economics
Whether you’re learning marketing frameworks, financial analysis, or management theory — see it all structured like a map.
🧭 Macro Frameworks
Explore IS‑LM, AD‑AS, Phillips Curve, business cycles, fiscal & monetary policy tools – all visually accessible with data overlays.
📈 Micro Fundamentals
Understand demand & supply, elasticity, market structures, game theory, and consumer choice with real‑world examples.
🏛 Policy Toolkit
Delve into inflation control, unemployment remedies, taxation impact, and trade tariffs – run side‑by‑side scenario simulations.
🔢 Data‑Driven Insights
Access live macro indicators, interactive charts, and downloadable datasets integrated right inside the graph.
🌐 Global Case Studies
Study 30+ country‑level deep dives (US, EU, China, EMs) with historic crises, policy shifts, and growth patterns mapped in one tap.
🎓 Exam‑Ready Toolkit
Quick‑review flows for AP/IB, CFA Level I & GMAT – over 450 flash concepts & formulas linked to the relevant nodes.
What Can I Do With This Graph?
- Study faster – follow curated paths for exams (AP/IB, CFA L1, GMAT Economics).
- Teach visually – project the map in class & toggle layers live.
- Research smarter – jump between theory nodes & empirical evidence in two taps.
- Prep interviews – refresh 60+ policy tools & their real‑life outcomes in 10 minutes.
Ready to Explore the Economy?
Subscribe nowOne‑tap cancel anytime.