Visualize Your Investing Strategy
Learn how pros invest — with interactive graphs designed for clarity, focus, and real-world results.
📉 Why Investing Feels Confusing
- Too much scattered information
- No clear investment structure
- Hard to connect theory with real decisions
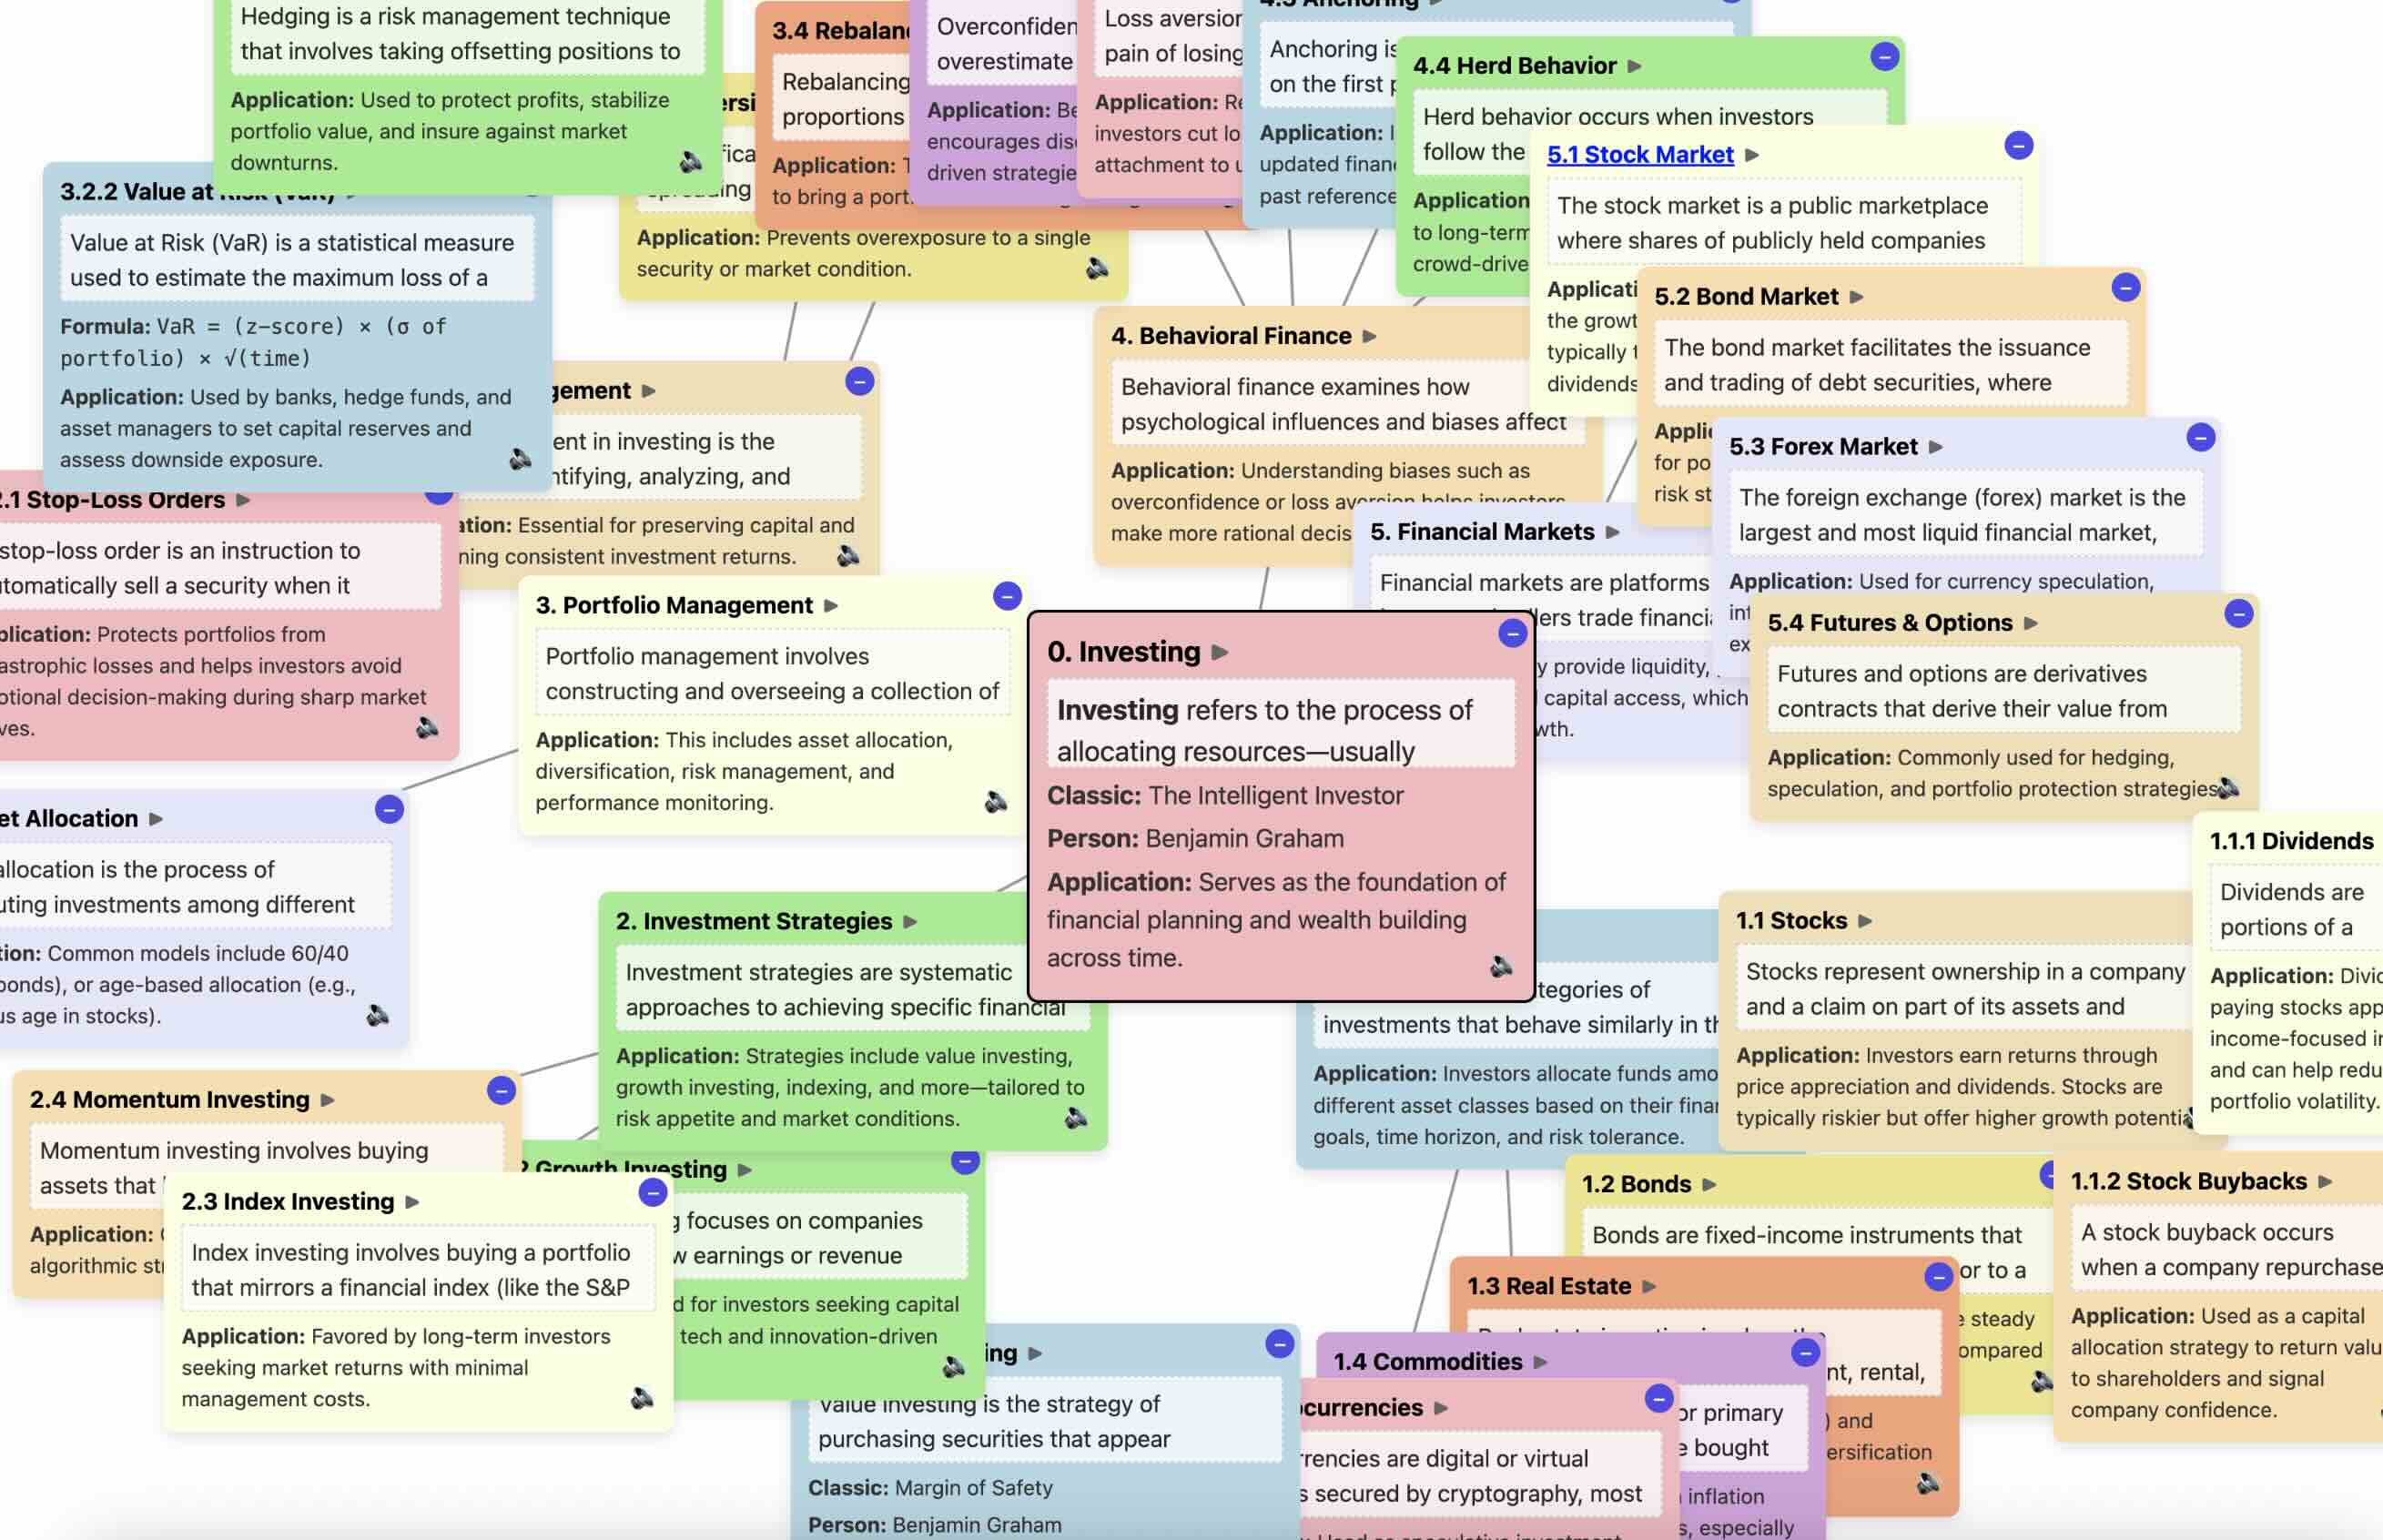
📊 StockMap Solves It Visually
From risk profiles to asset allocation models — explore investing through dynamic, explorable graphs.
🌟 What Users Are Saying
“This app made it so much easier to structure my investing mindset. Love the visuals!”
“I finally feel like I understand asset allocation after walking through the StockMap.”